An in-depth data-driven performance analysis of Palmer’s offensive proficiency across the campaign

FC Juanalytics
September 22nd, 2025
The date is January 14th, 2025: Chelsea are playing Bournemouth at Stamford Bridge. Nicolas Jackson receives the ball just past the half-way line – he holds off his man, turning him before threading a through ball to Cole Palmer, freeing him one-on-one against the goalie. With the goal in sight, Palmer dummies Mark Travers, sending him one way, before calmly slotting the ball into the other side of the net. As Palmer wheeled off in celebration, it’s unlikely he’d be thinking that would be his last goal in the Premier League until May, where he converted from the spot against Liverpool, let alone his last goal from open play until mid-September.
Palmer’s 2024/25 campaign had got off to a stellar start, with 4 goals against Brighton, including a stunning free kick from 25 yards out, being the jewel in the crown. However, at the turn of the year, his goalscoring form took a nosedive, with there being various conflicting narratives as to why Palmer’s performance levels dropped so substantially. Was he getting less involved in play, or in less dangerous areas – are his actions simply becoming less dangerous, and is he simply becoming less effective? These are some of the questions Chelsea may be asking themselves but, above all, they’ll be wondering whether this could be a concern for the future, and how to avoid history repeating itself.
Throughout my analysis, I will be looking at various facets of Palmer’s player profile. As a player who plays across the forward line and from attacking midfield, there are some key attacking metrics to evaluate Palmer’s performance which I have partitioned into four sections: Shooting & Goalscoring; Touches & Overall Activity; Passing & Creativity; and Dribbling & Carrying. Across these categories, I will be exploring how Palmer’s overall performance levels vary over time through the creation of various graphs depicting a range of metrics, existing models, and my own models to evaluate his player performance. This includes identifying trends in changes in Palmer’s performance, and suggesting potential solutions to maximise Palmer’s performance.
Goalscoring & Shooting
First and foremost, to begin to understand why Palmer might have had such a prolonged goal drought, we must first zoom out and take a wider look at Palmer’s time at Chelsea, as some trends begin to become rather apparent.

Throughout the 2023/24 season, we can see how Palmer’s average non-penalty xG per 90 lays at an average of 0.38 – a very good return showing a strong ability to generate attacking output, which would put him in the 86th percentile in the league. Additionally, Palmer saw huge goalscoring bursts at various points throughout the season, namely first at around January 2024 but, most significantly, towards the end of the season. Here, as the graph shows, his performance for npG far exceeds that of his npxG. This is even considering the fact these are his performances for non-penalty metrics as, due to a substantial amount of his goals coming from penalties, this trend and spike would be even further aggravated were the plot for purely goals and xG.
Going into the 2024/25 season, Palmer’s trend of greatly overperforming xG continued throughout the first few months of the season. From January onwards, however, Palmer’s goalscoring form from open play would dry up entirely, as seen with the npG line tailing off and remaining at 0. Although Palmer’s actual npG went from 0.45 p90 in 2023/24 to 0.31 in 2023/24, his average xG p90 was, in fact, the same across both seasons, standing at 0.38. This begins to highlight the principal issue, which is that of Palmer going from a substantial over-performance on his npxG of 0.07 p90, putting him in the 73rd percentile for the 2023/24 season, to an underperformance of -0.06 – a significant drop off to the 23rd percentile.
With it being evident that Palmer’s goalscoring form steeply declined over 2024/25, it’s important to investigate factors that could have affected this. For example, how many shots was Palmer taking? How accurate were they, and how did the quality of his shots change over time?
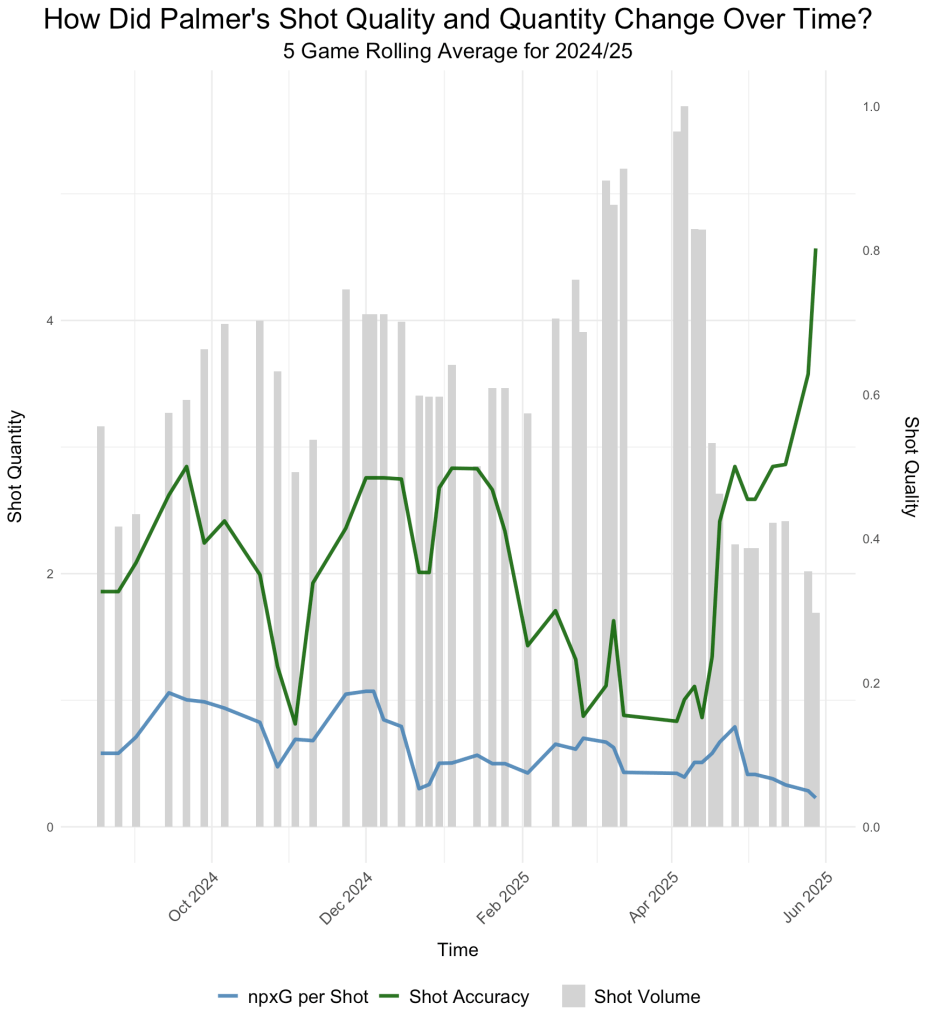
Palmer’s lack of goals past January was certainly not for a lack of trying. He was attempting somewhere between 3-4 shots per 90 before January, and this quickly rocketed past February, with his shots per 90 almost doubling up until April. This increase in shot volume, however, would fall just as quickly, dropping to around 2 per 90 for the final few months of the season. On the other hand, an interesting trend appears in Palmer’s shot taking: there seems to be a relationship between how many shots Palmer is taking, and their accuracy.
Once his goal drought had started, and his shot volume begins to increase, we can observe how his shot quality has an almost inverse relationship. Then, once his shot volume decreases, his shot accuracy increases in the opposite direction once again.
Why this could be is uncertain, although a theoretical suggestion – which will be explored further – could be that, as his goal drought went on, Palmer became more frantic in his shot selection. This would result in an increase in quantity of shots at the expense of quality in an attempt for Palmer to finally break his deadlock. This theory could also be supported by looking at the general quality of his shot selection, as seen with his npxG per shot. Up until December, where he was still in fine goalscoring form, he was averaging up to 0.2 npxG per shot – an incredible feat which would make him the best attacking midfielder / winger in the league, and even within the 90th percentile for strikers – with an average more around ~0.17 npxG per shot. Beyond that point, however, we can see how, after January, that begins to tail off and whilst there is a slow and constant recovery over time, his original shot selection quality is never recovered, before tailing off once again in May.
Overall, Palmer’s decline in goalscoring form since January certainly can’t be attributed to a lack of trying, with his shot volume increasing considerably since his goal against Bournemouth. However, this could have even contributed to the problem, with there being considerable evidence that, as time went on and Palmer’s shot-taking increased, his quality of shot decreased and, clearly, this didn’t help him end his goal drought. Instead, Palmer perhaps should have focused more on picking his battles more carefully. To try and prevent a similar drought looking forward, rather than trying to blitz the goal with low quality shots, Palmer could focus on prioritising higher quality shooting as, previously, the higher quality his shooting was, the more he was scoring – his ~0.17 npxG per shot, ~0.5 shot accuracy and ~3.5 shots per game he was putting up at the beginning of the season should be an achievable and optimally efficient shooting output to aim for to maximise his goal return in the future.
Touches & Overall Activity
Another crucial aspect to evaluate Palmer’s attacking performance would be Palmer’s ability to find himself in attacking positions where he can positively contribute to the attack. In a logical sense, the closer Palmer is to goal, and the more active he is in these attacking areas – that being the opponent’s penalty box and the final third – the more able Palmer is to score, or at least be in goalscoring positions, whether that be for himself or to set up a teammate.

Here we can see how the areas in which Palmer was touching the ball changed over the course of 2024/25 season to begin to give us an understanding of how the areas in which he was receiving the ball affected his performance.
From the beginning of the season to December, the proportion of Palmer’s touches in attacking areas (in the final third and the opponent’s penalty area) was continually increasing. These touches went from about 45 to 60 percent of his touches up until December, indicating Palmer was receiving the ball further up the pitch, hence in generally more dangerous areas. This trend, however, then reversed between December and about March, with Palmer’s touches in the final third contracting back to what they previously were, and his number of touches in his own defensive and in the middle third expanded significantly. This was then followed by two rapid spikes in opposite directions, with a sudden increase of proportionate touches in attacking areas around April, instantly followed by a decrease in touches in attacking areas towards May. This could go to show how, as Palmer’s goal drought longed on, he was dropping deeper to receive the ball in attempt to be more self-sufficient and try to make things happen for himself – with the exception of his large increase in attacking touches in April.
To further inspect Palmer’s attacking positioning and how dangerous it was over the 2024/25 season, I used various factors, as can be seen below, to create a Tactical Attacking Threat Model:

- Panel A)
Panel A shows Palmer’s overall touch volume per game over time. When looking at this and comparing it to the previous graph of where Palmer was touching the ball, the timelines seem to coincide where, the deeper Palmer was getting his touchers, the more touches he was taking overall.
- Panel B)
Panel B shows a model I created for how many touches Palmer was taking in attacking areas, where the more attacking the touch is – based on position on the pitch – the more handsomely it is rewarded. As with Panel A, the timeline for Palmer’s attacking touches track for previous trends seen regarding how Palmer’s quantity of touches affected their attacking quality.
- Panel C)
Panel C shows the percentage of passes Palmer received which were progressive, yet another statistic to show how Palmer was receiving the ball in attacking areas. Not to sound like a broken record but, once again, the timeline of the trends here can be mapped quite similarly onto previously discussed theories regarding Palmer’s zonal activity and his attacking proficiency.
- Panel D)
Finally, Panel D shows how Palmer faired on my Tactical Attacking Threat Model – this model indicates the attacking and progressive quality of Palmer’s touches, where positive values indicate that Palmer was receiving the ball in attacking areas and from progressive more often, and hence posing a more substantial attacking threat to the opposition through his tactical positioning, and vice versa.
Here, where his goalscoring drought begins in January, there is actually a small increase in his Tactical Attacking Threat, although this begins to fall off as the year progresses. This is before a tremendous spike in Palmer’s Tactical Attacking Threat in April, a feat we’ve seen of various other metrics so far, before an eventual tail off.
Interestingly, according to the model, throughout the earlier parts of the season where Palmer was still actively scoring, he was actually posing a more negative attacking threat – he was receiving the ball in less attacking areas and/or receiving less of his passes from progressive actions.
When lining up timelines with Palmer’s goalscoring, previous trends of a slow and continual improvement towards the early portions of the season – mostly up until December – are apparent, with Palmer continuously increasing the amount of his touches in more dangerous zones. However, as soon as his goalscoring dried up, we can see Palmer starting to drop deeper, with a greater proportion of his touches coming from deeper. Perhaps, as with his shot volume, this was a psychological thing, where Palmer thought that, by dropping deeper to receive the ball, and being more involved in play from deeper, he’d be able to progress the ball into more dangerous areas.
However, this was not the case, as it did not lead to that. Therefore, perhaps Palmer should have been more patient in terms of how and where he receives the ball and let the ball come to him in more dangerous areas – he has the individual quality to create something out of it, rather than seek it out in less dangerous areas and trying to make something happen. This is not to say that his goalscoring drought was based entirely on the way Palmer moved on the pitch as, despite the overall decrease in attacking involvement, the April ‘explosion’, so to call it, showed great attacking involvement, but didn’t bear any goalscoring fruits, signalling that perhaps the drop in performance was something beyond just where Palmer was on the pitch.
Passing & Creativity
As the primary hub for Chelsea’s attack, Palmer’s primary role is not only to score goals, but also to create them. Therefore, to properly evaluate his performance, it’s important to see how Palmer’s creative and passing numbers changed over the course of the season.
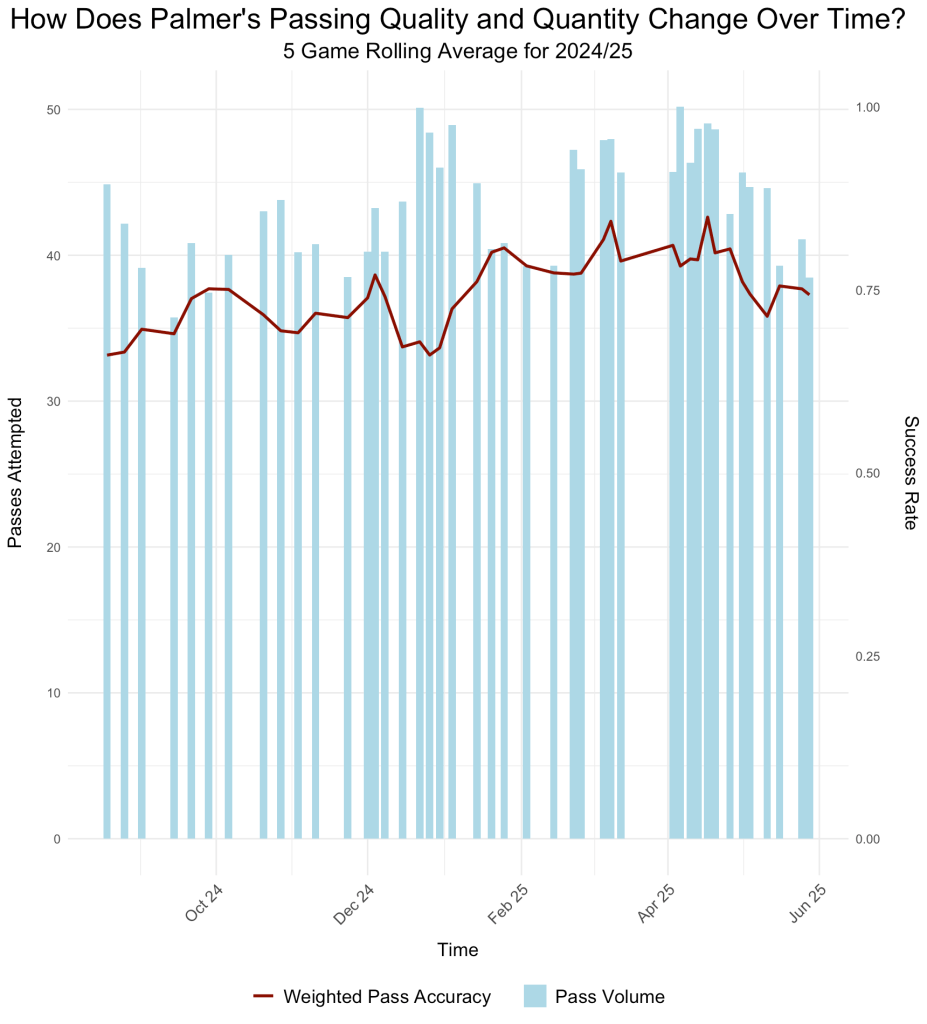
As can be seen, Palmer’s passing volume over the season is generally quite stable, typically within the range of 40 to 50 passes per 90. There are a few spikes – such as in January, and the timeline for Palmer’s increase in attacking touches seems to coincide with an increase in passing volume, like in April, but the overall variance isn’t too large. When looking at Palmer’s weighted pass accuracy – a metric which rewards successful passing more the longer the range of the pass is – we can see how Palmer’s weighted pass accuracy, over time, slowly increases, peaking around the aforementioned April period.
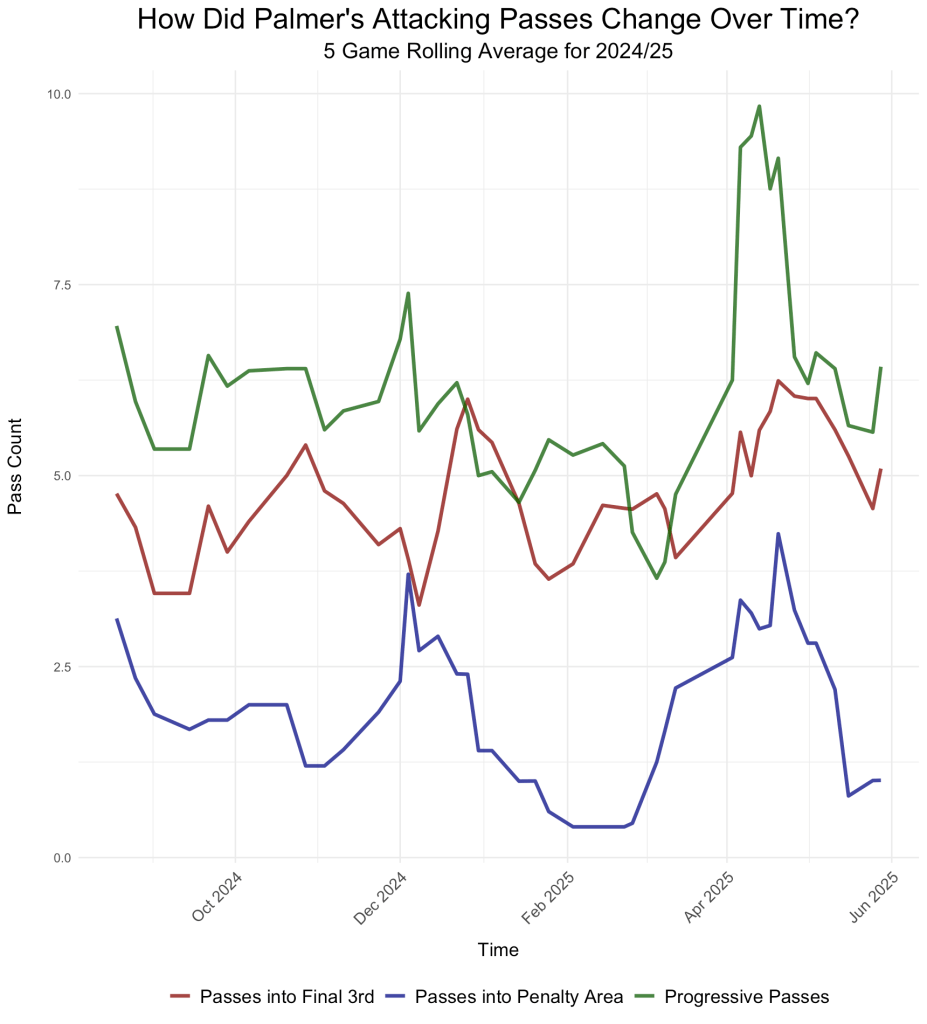
However, seeing just the quantity and quality through sheer volume weighted accuracies doesn’t provide enough of an insight as to how Palmer’s passing into attacking areas changed over time. Here, we can see how Palmer’s passes into the final third, into the penalty area, and his progressive passes. A similar trend appears here as we’ve seen with various other aspects of his touches in attacking areas, where his figures are fairly consistent up until the goal-scoring drought starts around January, then his attacking passes fall off, spiking back up in April before an eventual tailing off. This perhaps goes to support the theory that Palmer’s output had simply decreased for a while, and he’d hit a rough patch of form.
Beyond just Palmer’s passing and passing into attacking areas, another key aspect to his creative output is how his chance creation changed over time, and the relationship between the quality and quantity of his creative output. Here, we can see the relationship between his Shot Creating Actions (quantity) and his expected Assists (quality) over time. Firstly, this shows how Palmer’s average for SCA is 5.7 per 90, and how his average xA is roughly 0.26 per 90 – these are extremely impressive creative numbers, placing him in the 96th and 94th percentile in the Premier League for each metric respectively.

However, here we can see how, at various points, Palmer’s SCA and xA seem to have an almost paradoxically inverse relationship. The most explicit example of this is undoubtedly the period between February and May where, an increase in Palmer’s SCA to nearly 10 per 90 is met with a decline in his xA of virtually the same magnitude, falling to as low as under 0.05 xA per 90.
It cannot be understated how bizarre this trend seems to be, at least to this extreme. But even after these peaks, when returning to more relatively normal numbers, from May to June, xA and SCA still have an inverse relationship. This could be due to a phenomenon previously discussed regarding Palmer’s shot-taking where, in an attempt to try to ‘make things happen’, Palmer tries forcing more creative activity at the expense of the quality of his creation.

To test this, I created a model to show how aggressive Palmer was in his passing, the Pass Aggressiveness Index – which sees how much of Palmer’s passing distance was progressive – and saw how that plotted onto a Weighted Chance Creation model – taking and weighing expected Assisted Goals and Key Passes. This, however, appears to show a conflicting argument, as Palmer’s Pass Aggressiveness and Weighted Chance Creation have fairly similar trends. Over the course of the season, both drop – albeit the Weighted Chance Creation drops significantly more than the Pass Aggressiveness.
The point stands nonetheless that, as one is falling, generally, so is the other. The lowest point of both metrics are between February and April, perhaps showing how, in the immediate aftermath of Palmer’s goal drought, his general overall performance waned.
Overall, it’s complicated to really discern any meaningful insights from Palmer’s creative and passing performance over the 2024/25 season, with various related stats providing some conflicting narratives. Therefore, it’s quite complicated to be able to provide any potential suggestions as to how Palmer should be aiming to create for his team. His baseline passing volume and accuracy has no particularly interesting points of note, and his passing into attacking areas appears to be very much in line with his overall form. Then, potential theories regarding how, as the poor form continued, Palmer increased his creative attempts at the expense of creating higher quality chances are dispelled by how both his passing aggresivity and chance creation were dropping over time. The only conclusion which can be really be taken is that Palmer’s creative performance, as with his goalscoring performance, took a turn for the worst from January onwards, up until April where there was a large spike in performance, but then followed by another drop towards the end of the season.
Carrying & Dribbling
Another component of Palmer’s overall performance as the attacking workhorse for Chelsea is the way in how dribbled and carried the ball over the 2024/25 season. As a precursor to this section, however, it is important to note how take-ons have never particularly been one of Palmer’s strong suits. This is not to say that he is necessarily bad at it, simply that it’s not one of the most prevalent features of his player profile. For example, he is still generally around the 60th percentile in the Premier Legue both for take-on quality and quantity over both of his seasons at Chelsea. But when compared to the other aspects to his game: his creative playmaking, passing, and goalscoring, which are more between the 75th and 95th percentile, it’s important to note Palmer’s take-on ability has never been one of his standout features.

Nonetheless, similar to the other attacking performance metrics, we’ll first look at how his quality and quantity of take-ons changed over time. Take-Ons, in case the term is unfamiliar, is defined by Opta as ‘a successful attempt (…) to beat an opponent while in possession of the ball…’. So, functionally, it’s what is generally known as a dribble. Within this, there are no specific time-related trends to be observed – unlike with other stats we’ve looked, there is no prolonged period of a downturn in his take-on performance since January which could potentially point to a larger issue in overall performance.
The one trend which can be observed is that, when there are increases in the volume of take-ons (see November, January, April as examples), there is typically also a spike in Palmer’s take-on success rate.
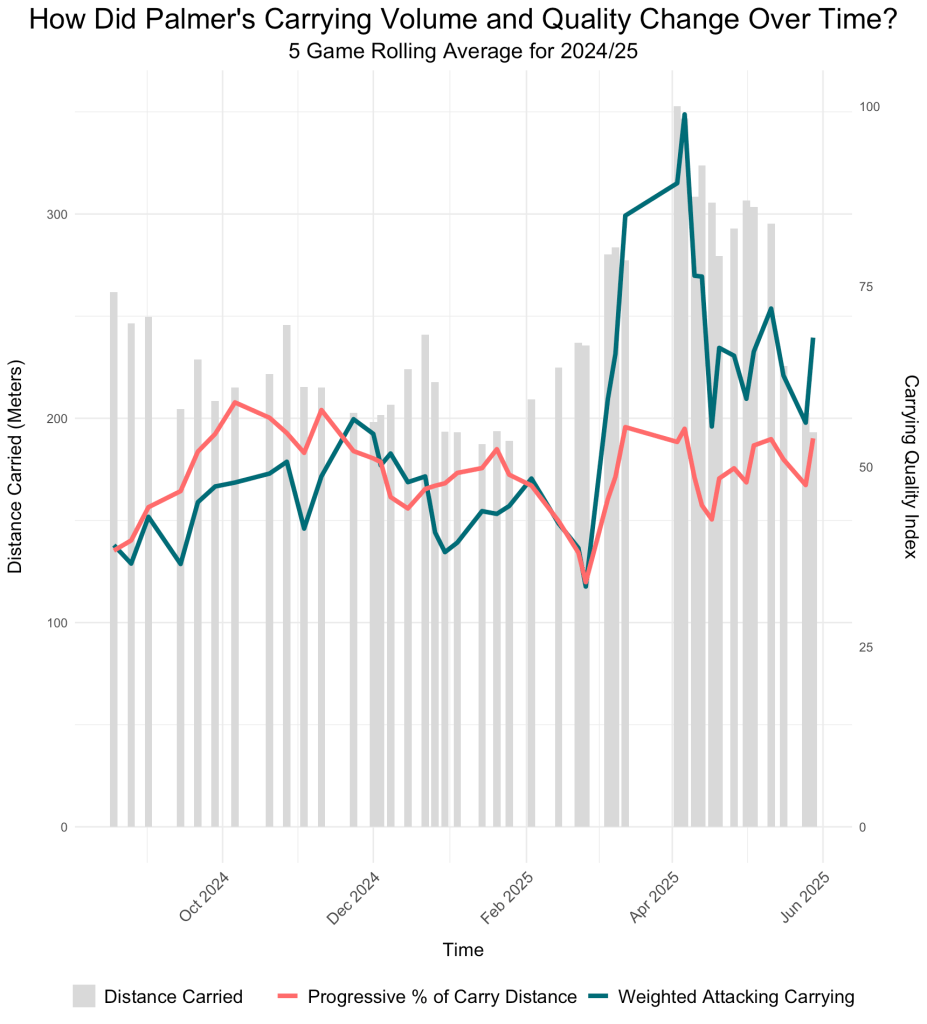
As well as take-ons, another important element to look at regarding Palmer’s proficiency on the ball is to look at his carries. Here we can see how the total distance he carries the ball per match changes over time, as well as the percentage of his carries which are progressive, and a Weighted Attacking Carrying Index which progressively weights individual carrying actions based on how dangerous they are (as adjudicated by their proximity to goal). Within the first half or so of the season, Palmer’s carrying distance, how progressive his carries were, and how often he was carrying the ball into attacking areas were fairly stable, with there not being too much variance in this time.
However, we can see how, going into April, all these metrics rocket upwards, signalling how, not only was Palmer carrying the ball about 50% more, but he was also increasing the percentage of his carries which were progressive, as well as a large increase in the attacking nature of the carries he was performing.
As previously mentioned, Palmer’s dribbling ability has never been a prevalent selling point for Palmer’s ability as a player – hence why it’s the final part of this analysis. There also seems to have not been as much of an impact on his dribbling or carrying performance during the months in which Palmer slumped in other metrics, possibly suggesting that Palmer is simply a 60-70th percentile dribbler in the Premier League, which is good, but to write home about. In terms of recommending improvements, since there wasn’t too many dips in form, I can only suggest that Palmer continues to try to increase his quantity of take-ons, as increased quantity saw increased quality, perhaps showing that, if he became a higher volume dribbler, he’d be able to elevate his numbers and complete his profile to be more well-rounded.
Conclusions & Recommendations

Overall, we have taken an in-depth look at various aspects of Palmer’s attacking performance during the 2024/25 season – one which included a vast goalscoring drought amongst other indicators of generally decreasing attacking performance. Throughout the season, Palmer experienced a continual decline in shot quality despite an increase in shot volume, decreasing attacking threat by receiving the ball further away from dangerous areas, and drops in the proficiency of his passing and chance creation. On the other hand, Palmer’s dribbling and carrying remained largely unaffected throughout the season, albeit it was never a particular strength of his, and there was an observably stark positive spike in performance across all the aforementioned metrics in April.
This spike in performance during April is what clouds the conclusive power of this analysis, creating ambiguity between whether the drop in form was a player-side issue, or a mere issue of variance, and that Palmer was simply underperforming – as one does from time to time. The reality is that the truth is somewhere in the middle. Even during this almost anomalous spike in performance during April, Palmer was still unable to break his deadlock – this then arises the question of whether perhaps Palmer simply went through some poor form and was unable to convert throughout the season. As discussed, however, multiple metrics demonstrate that Palmer’s overall attacking play simply became less effective, and this could well have led to his stark decrease in goalscoring.
It should be noted that, even despite the prolonged periods of Palmer’s season in which he was less efficient and active in his attacking play, over the course of the season, Palmer still averaged out to have a good season by Premier League standards. Many of these key metrics, whether that be for shot volume, passes or shot-creating actions – to serve as some examples – still put him at least within the 90th percentile for those statistics, even in spite of the fact they saw considerable down-turns towards the middle of the season. However, when you are expected to be the main player serving as the attacking hub for a team with aspirations to compete for Champions League football, and when your poor run of form coincides (whether the link be causal or correlational) with the team’s poor run of form which jeopardises the extremely lucrative competition revenue, as well as the increased prices negotiated for a front-of-shirt sponsor – can Chelsea afford for Palmer to go on a poor run of form?
Therefore, to ensure the minimisation of a risk of history repeating itself, this analysis can provide a few pointers to conclude. Palmer should aim to specialise as a final 3rd player – this involves being more patient while the team is in possession and positioning himself in attacking areas where the ball can come to him and he can use his superior qualitative player difference to create attacking threat. My analysis consistently shows how, the deeper Palmer is dropping to receive the ball, the more ineffectual he is becoming. This applies to shooting, passing, and creating, although not to dribbling and carrying as that always remains roughly the same. Therefore, to be able to fully maximise Palmer’s abilities, the analysts and coaches should work on him to let him be more patient without the ball – the ball will come to him naturally, and then he can use his abilities to unleash good quality shots, receive the ball in attacking areas, and create good quality chances but, above all, be able to not repeat his 8 month goal drought in open-play.

Leave a reply to Juan Vila Rodriguez (FC Juanalytics) Cancel reply