Running 10,000 simulations of my Football Manager save to make the most overly analytical transfer decision in FM history
Juan Vila Rodriguez
Table of Contents
TLDR
I was playing Football Manager 26 with Valencia and, through an array of decisions, ended up with a backup goalkeeper with 6 months left on his deal, and I had an offer worth £4.5 million to sell him.
Injury troubles across my goalkeeping department over the season led to a good run of form for the usual backup, which had given me cold feet over the sale. To decide whether it was worth it, I ran a Monte Carlo simulation in R over 10,000 simulated seasons. In the end, the results of my model where a resounding: sell. I reinvested the money I got into other signings to lead me to finishing third – the model was right and I, as I had predicted, was wrong
Navigate Table of Contents
Introduction
A few weeks ago, I began a save on Football Manager 26 with Valencia. Since the game’s release, with some spare time, I had been doing a save with Chelsea Women’s to familiarise myself with the women’s game – I’ve since been to 3 CFCW matches, home and away, and they were great fun!
Regardless, to keep it brief, I decided to give myself a new challenge. Valencia have been in a complicated situation financially for quite some years, and I wanted to see if I could take them to Europe, and then even further. But, upon a first review of the squad, a significant issue stuck out to me in the goalkeeping department.
Navigate Table of Contents
The Issue
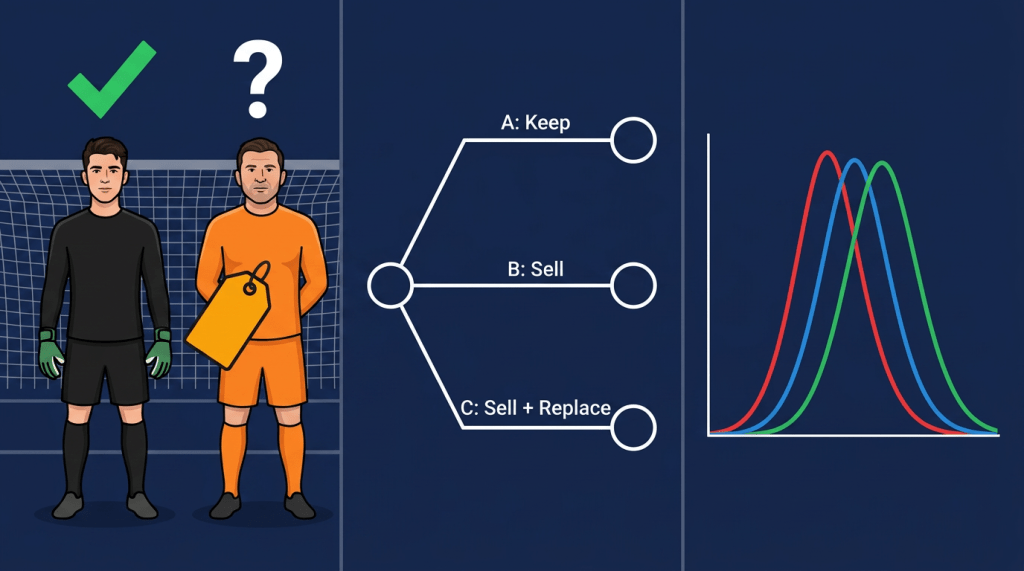
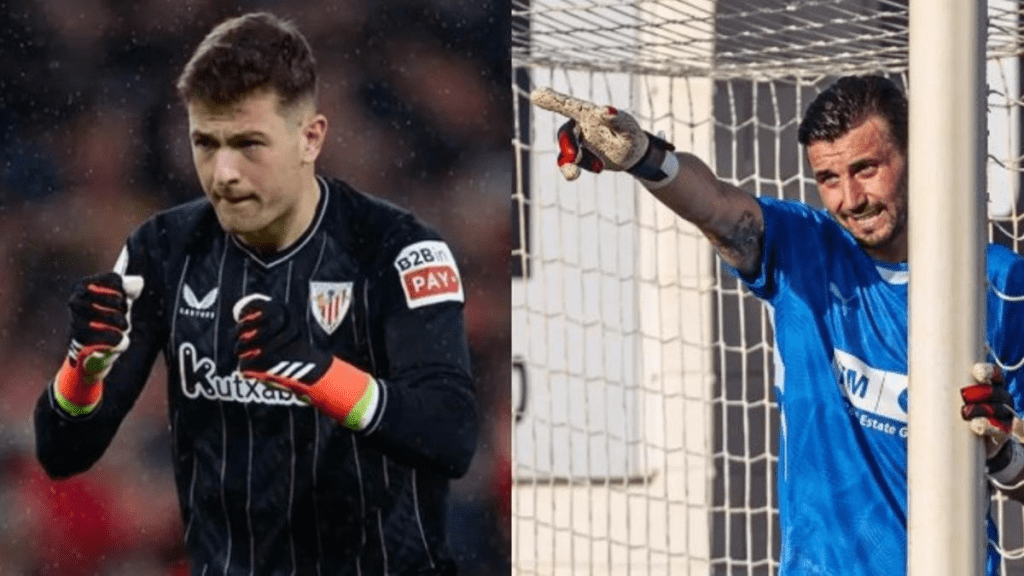
Let’s place ourselves within when I began my game: it’s July 2025 and, upon a first review of the squad, a major issue stuck out to me in the goalkeeping department. Valencia has three goalies on the first team: Stole Dimitrievski (31), Julen Agirrezabala (24), and Cristian Rivero (27).
Between these, Dimitrievski and Agirrezabala are of approximately equal ability, being an above average La Liga goalkeeper – they have slightly different skillsets, but round off to be of equal quality, I’ll give them a 7.5/10. Rivero, on the other hand, is about bang-average, if not slightly below that – I’ll give him a 4.5.
Dimitrievski and Rivero are permanent players at Valencia, although Dimitrievski has one year left on his deal. Agirrezabala, on the other hand, is on loan from Athletic Club, with a loan-to-buy option of £9M – which is considerably below market rate, but realistically irrelevant, given I went on to not trigger it.
Agirrezabala and Dimitrievski both come with expectations of being an ‘Important Player’ – they both expect to play a majority of matches – and are both costing my payroll £40K a week (~2,000,000$ a year). At the beginning of the save, this places both of my goalkeepers within the top earners. This is a wildly inefficient use of resources – having two goalkeepers of equal ability on equal wages is useless.
I had tried fixing this in the summer by selling Dimitrievski, but I couldn’t get a satisfactory offer, and Agirrezabala had no loan cancellation clause, so I would have to wait until January to amend the issue, hoping Dimitrievski – who I made my number 2 – wouldn’t make too much of a fuss about his lack of playing time by then.
We get to January and, with 6 months left on Dimitrievski’s deal, I got a deal to sell him for about £4.5 million. This would’ve solved all the aforementioned issues: got 40K off the wage bill, solved the playing time problem, and got me a few million. bagged me a few million to mess around with for my squad. The latter was especially interesting for me, given I had a few reinforcements I wanted to bring.
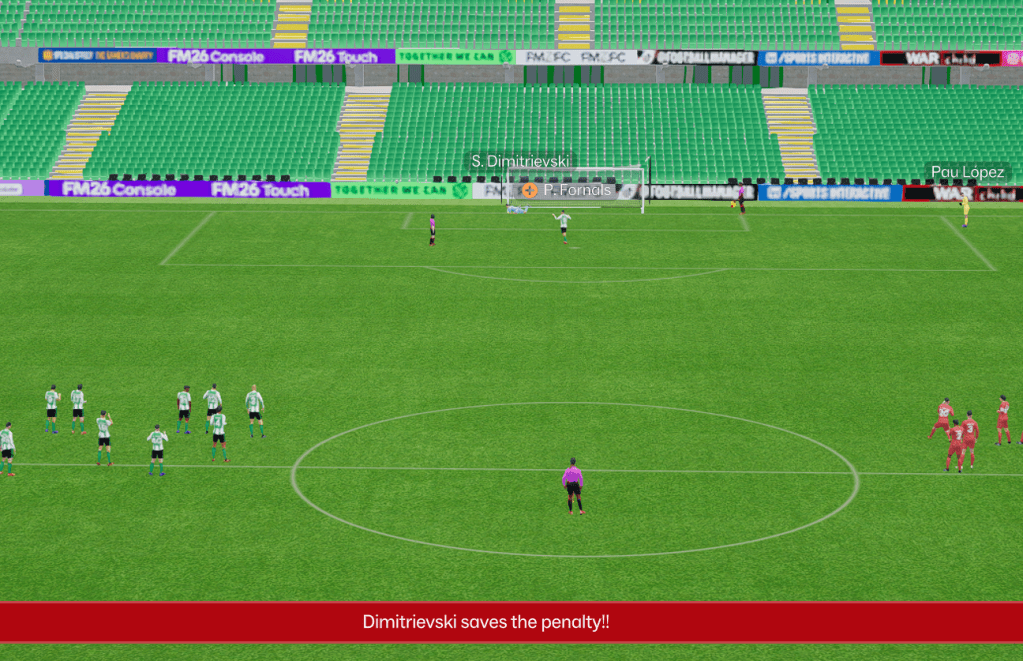
But, by this point, late in November, both Dimitrievski and Agirrezabala got injured within a week. Rivero had to cover for a league game – a mundane 0-0 draw away to Mallorca – and an easy 0-4 win against lower-league opposition in the cup. Later, in early January, Agirrezabala was out once again. Dimitrievski played in the cup against Betis, a game he would’ve played regardless, but kept a clean-sheet over 120 minutes, saving 3 penalties in the shootout, before keeping further back-to-back clean sheets against Getafe and Las Palmas.
By then, Agirrezabala, the usual first-choice, had returned, and I had started lining up replacements to replace Dimitrievski with part of the £4.5 million on the table. But, with none of them being quite as good, and Dimitrievski having played so well when called upon, I began to have doubts over selling him.
I was struggling to determine whether the sale, at a cut-price fee, would be worth it. Rationally, I knew all my doubts could easily be attributed to pure chance (one-off performances from Dimitrievski and Rivero). Nonetheless, the recency bias was giving me cold feet, so I decided to work out just how worth it the sale was.
Navigate Table of Contents
The Method – Running the Monte Carlo Simulation
Before, I mentioned I had been lining up replacements – before letting the deal go through, I agreed a deal to sign Aaron Escandell for £2.5 million, on 17k a week.
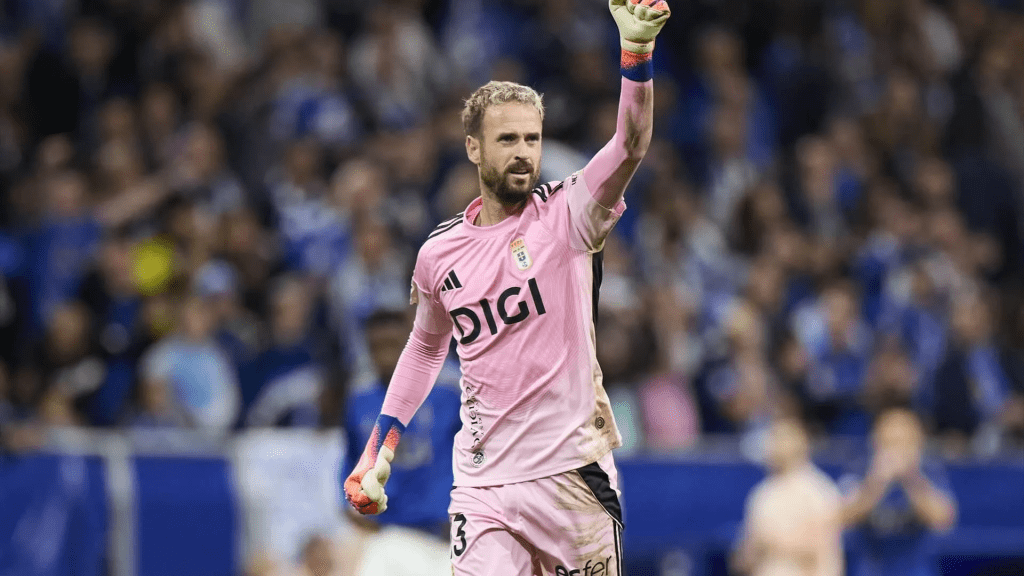
I also alluded to Dimitrievski, Agirrezabala, and Rivero’s numbers as ratings out of 10, Football Manager gives this as stars. Dimitrievski and Agirrezabala are 3.5 star goalies respectively, Rivero is a 2.5, and Aaron Escandell is a 3.
The model built compares three decisions against each other, creating a decision tree:
- Keep – Dimitrievski stays. No financial gain, no change to backup quality if Agirrezabala gets injured
- Sell – Take the £4.5M, save the wages, and leave Rivero as the only backup. Most financially optimal, but riskiest sporting-wise
- Sell and Replace – Get the fee, and wages off, but bring Escandell in for half the price, and on half the wage burden, maintaining more adequate cover.
The Monte Carlo simulation runs 10,000 iterations of the rest of the season across each branch. It’s a useful method here because the outcomes aren’t fixed – they all depend on: if Agirrezabala gets injured, how long, what that impact on the team would be. Instead of getting a single outcome or value, we can see the distribution of outcomes across thousands of seasons.
The Results
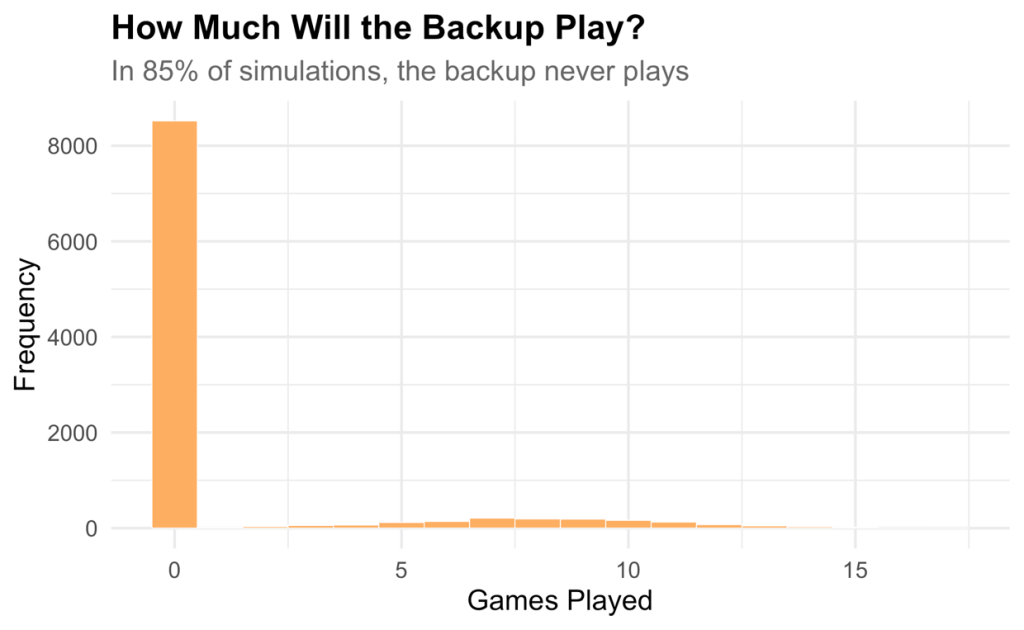
To measure the impact of a substitute goalie, we should first quantify how likely it is for the backup to even matter. We give that the remaining games are 17, based on general La Liga timetabling, and that injury rates are within standard range, with no expectation for either to be especially prone (as their scouting report doesn’t suggest that should be of concern).
As the figure below shows, in 85% of our simulations, the backup never plays. This shows how, in a vast majority of the cases, having a competent backup goalkeeper is somewhat like insurance.
Net Value by Decision
Since the fundamental goal of this experiment is to see whether the financial incentive outweighs that of the sporting, it’s also important to first visualise the financial incentive.
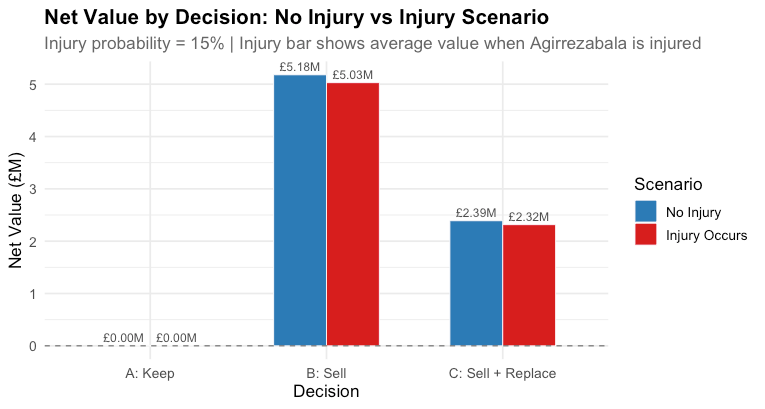
Here, even in the unlikely scenario within the probability tail that Agirrezabala gets injured and misses games, incurring a negative effect on performance, on average, both selling decisions still have substantial gains over the zero gains generated by keeping him.
This summarises the basic model: keeping Dimitrievski generates no financial gain. Selling and/or Replacing have some benefits. From this, the logical conclusion is that selling outperforms keeping financially speaking.
Effect on League Points
Beyond just the financial implications, however, are also the impacts of replacing our equally-able substitute goalie on the pitch. We take the star rating system provided by Football Manager as a proxy for goalkeeping ability, which we quantify with the single metric of PSxG-GA p90 (on average, how many goals a goalkeeper saves above the average goalie every game).
Assuming a linear relationship between a goalkeeper’s inherent ability and their shot-stopping, hence between the star system and PSxG-GA p90, our hypothetical goalies would have the following impact on games:
- 3.5 Star (Dimitrievski + Agirrezabala): 0.10 PSxG-GA p90
- 3 Star (Escandell): 0.05 PSxG-GA p90
- 2.5 Star (Rivero): 0.00 PSxG-GA p90
Transferring this to the actual potential impact on the remaining 17 games, we’ll look at how possible goalkeeper substitutions could affect point outcomes below.
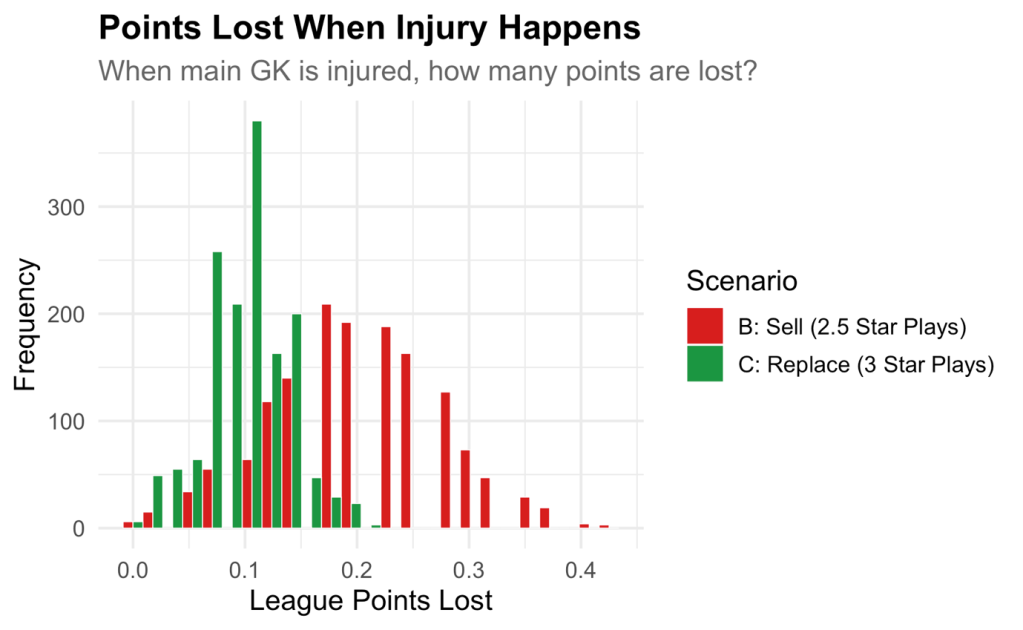
Firstly, according to the assumptions, here there is no result for Scenario A (keeping Dimitrievski), as that would see no outcome on performance.
Instead, we see how, even in a marginally worst-case scenario (where Agirrezabala gets injured), points lost are marginal. Option B has a wider spread, reaching as high as 0.4 points lost over the season, whereas Option C has a much tighter spread, and lower, barely exceeding 0.2 points lost.
Option C clearly exceeds Option B in a vast majority of simulations, although the negative outcomes on points are still incredibly marginal – almost to the point of insignificance. It should also be noted these are based on very loose assumptions, which are addressed in the Limitations section.
Effect on League Position
At the time of the sale, I was sitting 5th in the league – doing well, and considerably above board expectations, which would’ve taken a finish in the top 10. I was aiming for Europe, however, so we translate the effects on points from each decision into how it would affect the league position, and the results can be seen below.
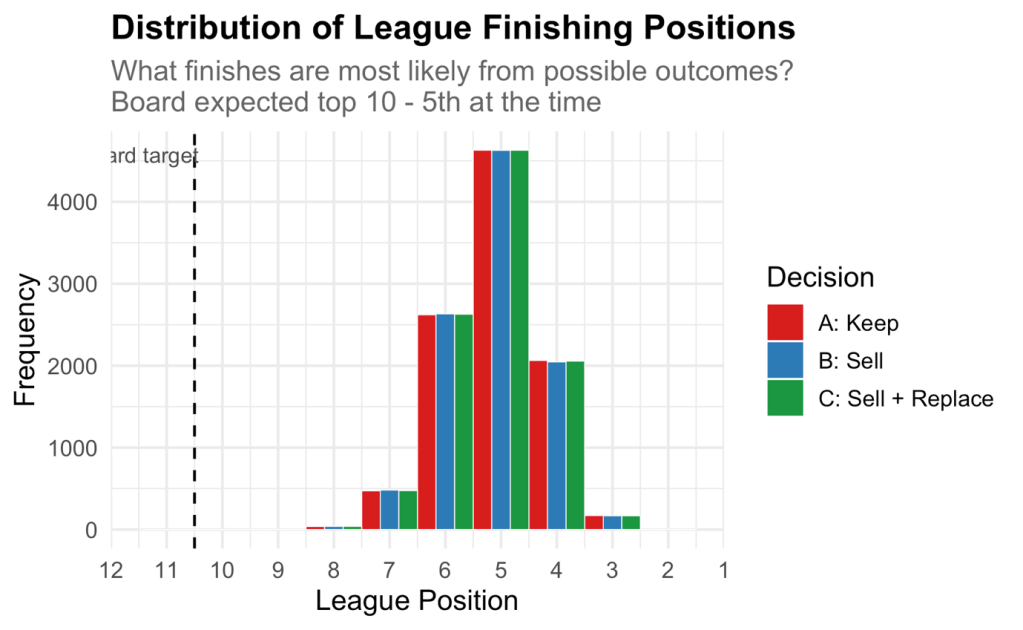
Across all decision branches, the effect on our finish in the league is essentially the same – with primary clustering being around 5th. It must be said, this specific distribution comes with some rather heavy caveats but, again, these will be discussed later on.
Overall, it shows how the decision regarding goalkeeper depth does not move the needle on our final finish, achieving the board’s target in 100% of simulations, and our own achievements in an overwhelming majority.
Final Outcomes After League
Based on league position outcomes, sourced directly from La Liga, there is then another aspect to be considered under the financial outcomes: not only the fee bagged from the sale and wages spent or saved, but also the difference in income from La Liga based on positions.
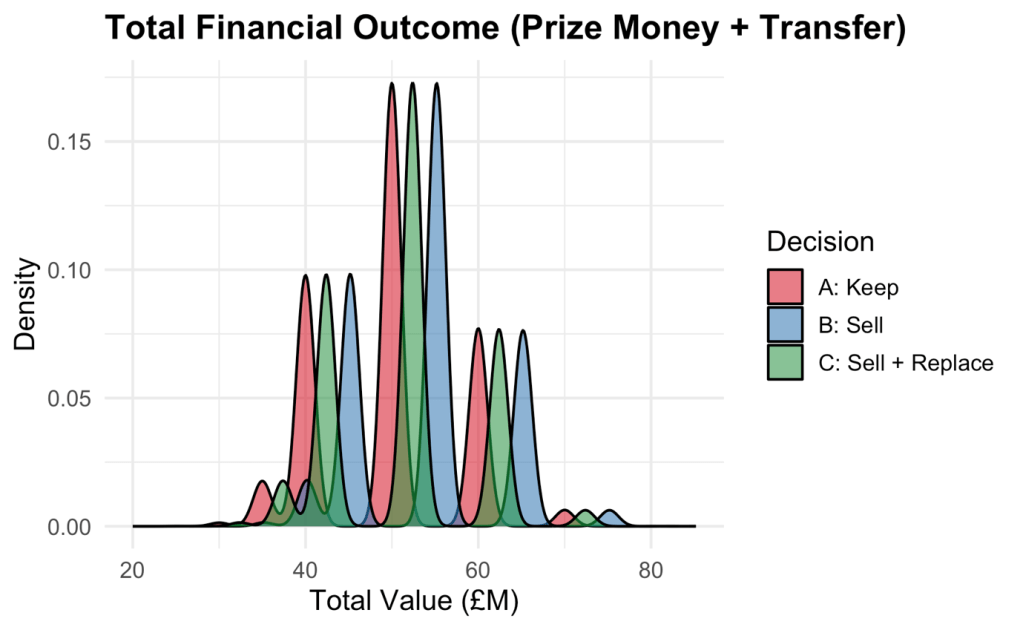
The multimodal shape reflects how the model gives prize money to jump discretely between finishing positions, so we get clusters of outcomes at each position’s prize money level. What’s more important, however, is how Option B and C are consistently to the right of Keep, with mean total values of ~£54m for Sell, ~51m for Sell + Replace, and £49m for Keep.
Break-Even Analysis
Finally, bringing it all together, we take a look at: how long would Agirrezabala have to be injured for keeping Dimitrievski to become the better option? The answer to this can be seen below.
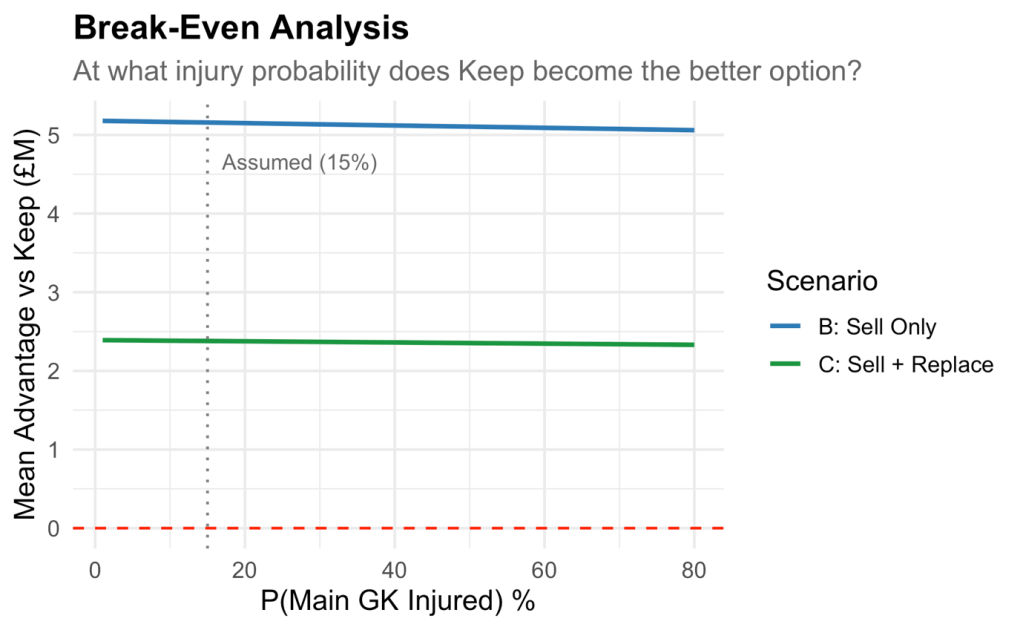
The answer is fairly simple: our simulated model shows that there is no injury scenario in which keeping Dimitrievski is worth it. Even if there were an 80% chance Agirrezabala got injured, as the line doesn’t cross 0, it still wouldn’t be worth it.
The financial advantage is simply too large relative to the marginal sporting cost of a slightly worse backup. Then, given our assumed 15% injury rate, it’s still far to the left of any potential break-even – this just reinforces that the cold feet I was getting regarding Dimitrievski were, as suspected, irrational.
From this model, I took: sell Dimitrievski, sign Escandell, then reinvest the difference into other areas of the team to better improve our odds.
Navigate Table of Contents
Limitations
The model, however, as one would expect, certainly has its flaws – here, we break each down.
Using Football Manager’s Star Rating
Firstly, using the star system provided by Football Manager, even within the game, is fundamentally flawed. These are ratings generated by your staff member, and their accuracy is dependent on their in-game ability – therefore, poorly equipped clubs may be feeding systematically biased ratings into the model.
If the coaches providing the ratings are fundamentally incorrect, whether it be over or underrating any of the options, the performance gap we’re modelling becomes flawed from the beginning. This is a fundamental limitation to have in mind: the input quality is bounded by the quality of the staff generating it in-game.
PSxG-GA as Quantifying Goalkeeper Ability
Using PSxG-GA as the sole metric to indicate a goalkeeper’s performance, and hence their ability, also missed considerable dimensions of goalkeeping. As I briefly mentioned previously, Agirrezabala and Dimitrievski have different profiles, impacting how they ‘goalkeep’.
Agirrezabala is generally more proactive – he’s stronger athletically, with a stronger tendency to rush out of his goal, claim crosses etc. These contributions are more preventative, and hence wouldn’t be captured in a metric like PSxG-GA, given that only occurs with shots against, and Agirrezabala is more attuned to preventing that.
Dimitrievski, on the other hand, is more reactive, and a stronger shot stopper, but less proactive shot preventor. Therefore, using this one metric can under-sell certain goalkeeper types who, despite not having the same pure shot-stopping ability, generate the same value through other measures.
Therefore, a more complete model would use more of a composite metric, perhaps bringing in statistics like a goalkeeper’s % of crosses claimed, or their actions outside their box as measures of more proactive goalkeeping.
Mapping Stars to PSxG
The way in which we map a goalie’s stars, as a proxy for his ability, to the PSxG-GA, to show their impact on the pitch, is completely arbitrary. The values assigned are not founded in any sort of empirical reality regarding the distribution of real goalkeeper PSxG-GA values, instead simply assuming that the relationship between a goalkeeper’s ‘ability’ and their shot-stopping impact is linear.
In real life, this may not be the case – the gap between 3.5 and 3 stars may not be equal as th gap between 3 and 2.5 stars. To base upon the empirical distribution of goalkeeper statistics, this would’ve required pulling actual statistical distributions across a large enough sample of goalkeepers which, given the size and actual impact of the project (not very impactful or important), I thought to be simply overkill.
Single Injury Assumption
The models simulate, at most, one significant injury to Agirrezabala – one which could rule him out for the rest of the season, at various points. It doesn’t account for, however, some shorter absences which may occur over the season, which are more common.
For example, Agirrezabala being out for two games on three occasions would be just as disruptive as a six-game injury, but the model does not account for this, nor treat them the same way. It also doesn’t account for either one of Escandell, Dimitrievski or Rivero getting injured too, as either of these events could greatly affect our decision tree as well.
Ceteris Paribus
When looking at the impact on league position, a fundamental flaw in the model is that it assumes all else to be equal – hence the assumption of ceteris paribus. In reality, selling Dimitrievski gave me just enough money to take and invest elsewhere in the squad in areas I thought were more important, consequently indirectly improving my league finish.
The model, however, only captures the direct impact of the decision in complete isolation, not allowing to capture what the freed-up money could do, meaning it likely understates the case for selling.
The same can be applied to every other club in the League – they too are assumed to be static. The plot showing the distribution of league positions assumes that other teams can’t also reinforce their squad in January, or even get weakened, or that they won’t go on better or worse runs, suffer their own injury problems etc.
Assumptions’ Impact on Income
Firstly, the element the model doesn’t capture is the impact selling a back-up goalie can have on cup competitions. Selling the goalkeeper best equipped to maintain performance in cup competitions will likely have impacts on performance in the cup competition. Bringing a worse goalkeeper could jeopardise this, missing out on prize money or even a route to European qualification.
Secondly, the assumption that the only effects on financial output would be league prize money as the return on sporting performance. This ignores the fact that finishing higher will likely bring greater commercial and broadcasting revenue through more general eyes on you. These effects are harder to quantify cleanly, hence are excluded. Nonetheless, it shows how the model likely understates the financial value of a higher finish – the prize money figures are more the floor than the ceiling.
Finally, and most importantly, is the impacts that performance could have on qualification for European qualifications – the model omits this. If we were to finish in the top four – or five, if UEFA coefficients are lucky – the financial consequences would go well beyond La Liga prize money. Even getting into the Europa League group stage would generate revenue in the tens of millions, let alone the Champions League.
About Assumptions
All in all, these assumptions could be argued to be necessary due to the sheer simplicity of the model, by design. Neither particularly overturn the core finding either, if anything they’d only further make the point, that the financial dominance of selling is simply too large.
But, all together, they can serve as a useful reminder that the model is simply a structured way of thinking through a decision, and not a guaranteed map of what will happen. Even under the generous assumptions, the break-even analysis still doesn’t cross zero, and this is primarily what makes the conclusion defensible – despite its imperfections.
Navigate Table of Contents
Conclusions
In the end, I took the decision of selling Dimitrievski, and then I signed Escandell.
The model confirmed what the rational side of my brain had been thinking – Dimitrievski’s recent strong performances could be attributed entirely to noise, and should not. Selling a 32-year-old backup in my highest earners for a decent fee with 6 months left was certainly the right choice – the sporting loss was close to none, especially when I was working on such a tight budget in that January window.
For the rest of the season, Agirrezabala stayed fit, and Escandell didn’t play a single league minute. I ended up taking the extra money and wage space to loan in players in a few key positions, like Maroan Sannadi, a striker who scored 6 goals in the last half of the season, or Sebastiaan Bornauw, a centre-back who got an average rating of 7.29 over 14 games.
Together, these two helped me push on in the league, finishing 3rd in the league, getting the club their first top 4 finish since 2018/19. This, of course, would challenge the key assumption of ceteris paribus, going to show how the benefits of selling Dimitrievski and replacing him had knock on effects which allowed me to improve my performance.
The real value in this whole thing, however, wasn’t just the output, it was the practice of finding the facts in a situation when my instinct was steering me incorrectly – particularly when I was aware of that. Modelling the situation certainly didn’t remove the uncertainty I had, but it helped to quantify the magnitude of the dilemma.
Overall, the exercise was good practice in data-led decision-making – a very important factor for me. Being able to create a framework to model these issues – even if imperfect, although acknowledging the imperfections is just as crucial – forced me to better articulate my assumptions, how they could affect probabilities, then see if my hypothesis was correct. Of course, the model wasn’t entirely right: as I’ve extensively discussed, it was deeply flawed, but being able to create such processes to make decisions one knows are optimal is crucial.

Leave a comment