A data-driven look at what separates the WSL’s best teams from set-pieces from the rest, using three seasons of team-level data

Juan Vila Rodriguez
Table of Contents
- TLDR
- Intro
- Set-Piece Scoring in the WSL
- What Do Strong Set-Piece Teams Have in Common?
- Are Good Set-Piece Teams Distinctively Good at Set-Pieces?
- What Factors Predict Set-Piece Performance?
- Conclusion
TLDR
Across three seasons of the WSL, teams that consistently score from set-pieces share a common profile. They generate more situations from corners and free-kicks, create more shots from them and, most importantly, convert them into assists at above-average rates.
However, there isn’t a wider playing style they share (i.e. possession dominant vs counter-attacking). Instead, what links good set-piece teams is strong delivery and ability to convert through various avenues.
The skill is far beyond general attacking play – corner volume is largely a byproduct of being a good attacking team. However, what separates the good set-piece team from merely attacking sides that, as part of scoring lots of goals, score from set-pieces, is what happens after the set-piece is won and how.
Whether the advantage in delivery and conversion is personnel-driven, noise in a 3-season sample, or coachable is a different question. Both Arsenal and West Ham appointed dedicated set-piece coaches throughout the sample window, and whether they gave a substantial advantage will be answered in the follow-up piece on FC Juanalytics.
Navigate Table of Contents
Intro
In recent years, spurred by Arsenal’s surgency to Premier League stardom, the world of football has been completely captured by set-pieces, taking them from a niche point of discussion to a prevalent tactical aspect of the game. A set-piece is any phase of play that restarts after a stoppage – whether it be a corner, a free-kick, a penalty, or even a throw-in. They are typically characterised by both teams having time to organise, and where a well-drilled routine can help break down a defence.
On average, somewhere between 25 and 30% of all goals come from set-pieces. However, across most professional clubs, practicing set-pieces occupies a fraction of training time relative to open play. In a sport like football, where goals are such rare events, a single set-piece can be the difference between three points and one: the difference between European qualification and mid-table, or the difference between staying up and going down.
Why might this be? Why is it set-pieces are such an under-utilised and under-exploited tool? Coaches and players alike agree it’s simply a tedious process. Imagine having to practice corner routines in November – it’s pouring rain, the ball barely bounces in the water-logged, muddy grass, and you’re having to stand still whilst you wait for your teammate to deliver the ball between some dummies.
However, the teams that do invest – like the aforementioned Arsenal, or the likes of Brentford before them – clearly benefit. This raises the question we try to answer today: what does a good set-piece team actually look like?
Is there a common profile shared in the data? Is it an attacking side that generates more set-piece situations, or teams with a specific skill for converting them once they arrive? Is being good at set-pieces a distinct quality, or simply downstream of being a good team in general?
To find out, we take three seasons of team-level data from the Women’s Super League (WSL) – England’s top women’s division – spanning from 2022-2023 through to 2024-2025. We combine exploratory data analysis with supervised and unsupervised methods to characterise what separates the WSL’s best set-piece teams from the rest.
Nonetheless, it is apparent that it is crucial for more teams to devote more time to such a fundamental facet of football. However, where does one start? How much can one optimise their set-piece performance without knowing how teams become good at scoring from set-pieces?
Navigate Table of Contents
Set-Piece Scoring in the WSL
First and foremost, to understand the teams successful at scoring from set-piece situations, it’s first important to understand the overall scope of teams success from set-pieces.
If every team scored equally, the concept of ‘being good’ at set-pieces would be null. However, as we see below, this is not the case.
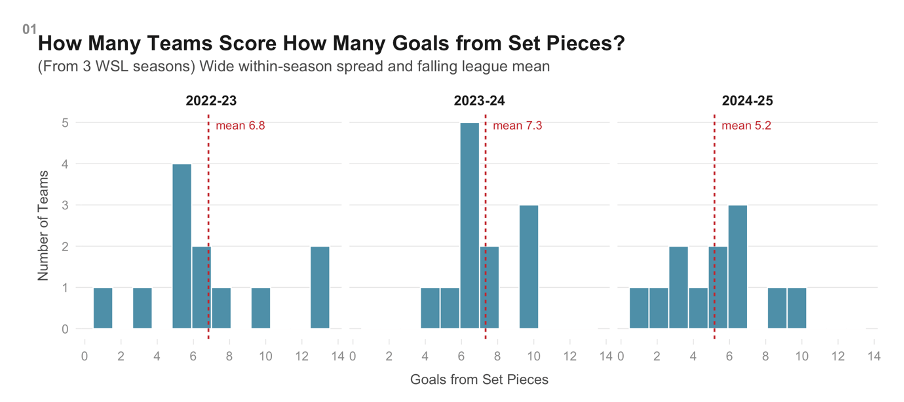
Across our 3 seasons of data, there is a general cluster of teams in the mid-single digits. There are, however, longer tails. In 2022-2023, most sides land between 4 and 8 set-piece goals, but 2 sides pull considerably ahead with 13. In 2023-24, the modal band tightens around 6 to 8, with 3 teams up at 10 – again, showing a large pack then a few outliers. In 2024-25, the distribution flattened out significantly: teams were spread more equally between 1 and 10 set-piece goals, without the same trend as seen before.
As shown by the red dotted lines, the season means also sees a slight decline, as can be better seen below.
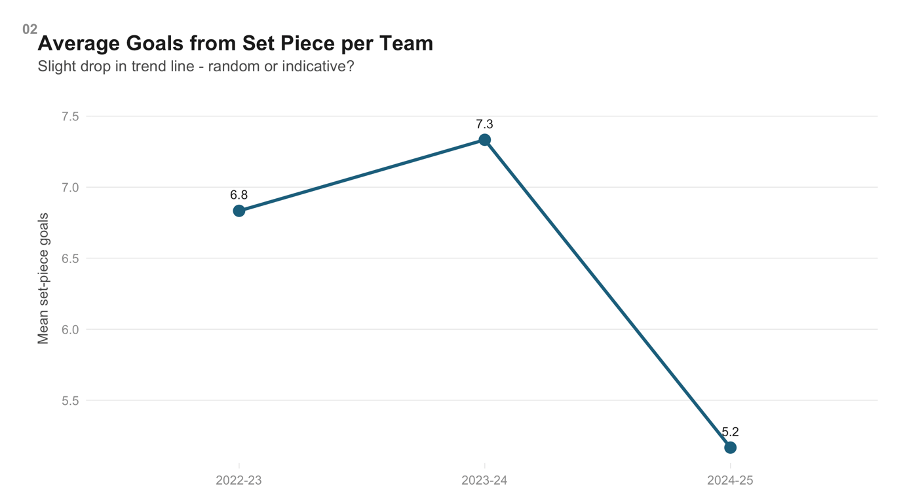
This trend line illustrates a roughly 30% fall from peak to trough. Initially, this may give a somewhat counter-intuitive narrative – as set-pieces became more mainstream, they became less common? Intuitively, this doesn’t make much sense. However, it might simply be volatility seen from such a small-sample across twelve teams.
What is important to consider, additionally, is the spread within each season between teams – namely the gap between the top and bottom teams.
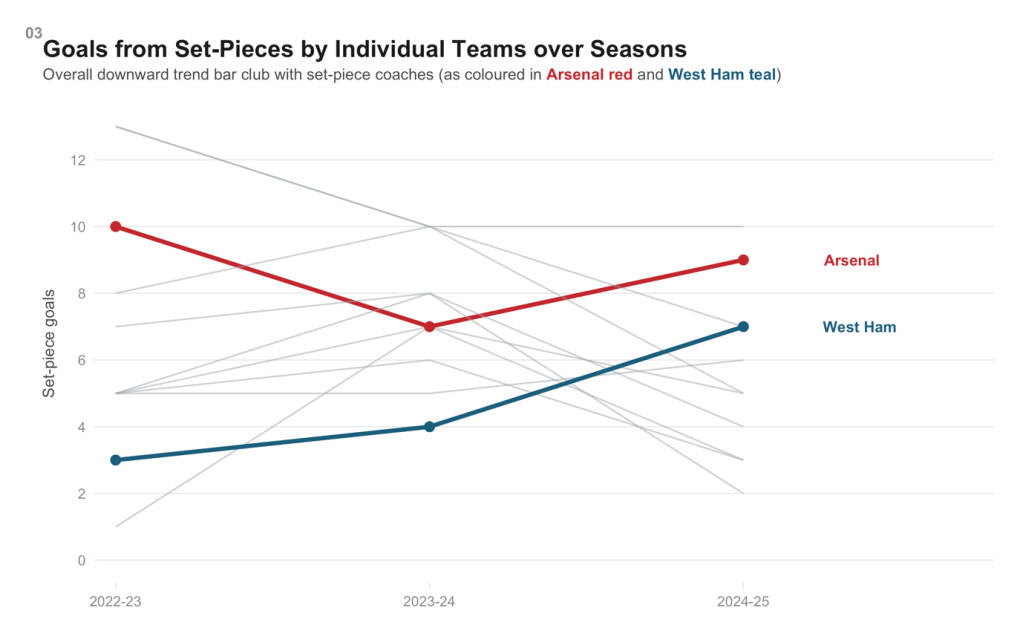
As seen above, generally, most teams appear to have a fall in goals from set-pieces over seasons. That is besides Arsenal and West Ham – these two teams are higlighted due to their hiring of a coach specialising in set-pieces at a given time throughout our sample.
On Arsenal’s side, Patrick Wingqvist was the dedicated set-piece coach for 2023-2024, before Chris Bradley took over for the 2024-2025 season. For West Ham, Chris Pipe was appointed in August 2023, ahead of the 2023-24 season, and has continued in the role throughout 2024-2025 (also sharing his roles with being a goalkeeping coach).
This trend and persistence is important consider now – if a given team is consistently scoring from set-pieces over three seasons, this would suggest the presence of a structural factor. Whether it be a certain way of playing, certain routines, or a squad designed to optimise these situations, consistent strong performance certainly suggests something positive is happening behind the scenes and manifesting itself.
Navigate Table of Contents
What Do Strong Set-Piece Teams Have in Common?
If Arsenal and West Ham are consistently scoring from set-pieces, there is a question worth asking: why? Is there a common way of playing? Are teams good at set-pieces good at pressing, or retaining the ball, or whatever it may be! The correlation matrix shown below shows how each variable within our dataset correlates with each other.
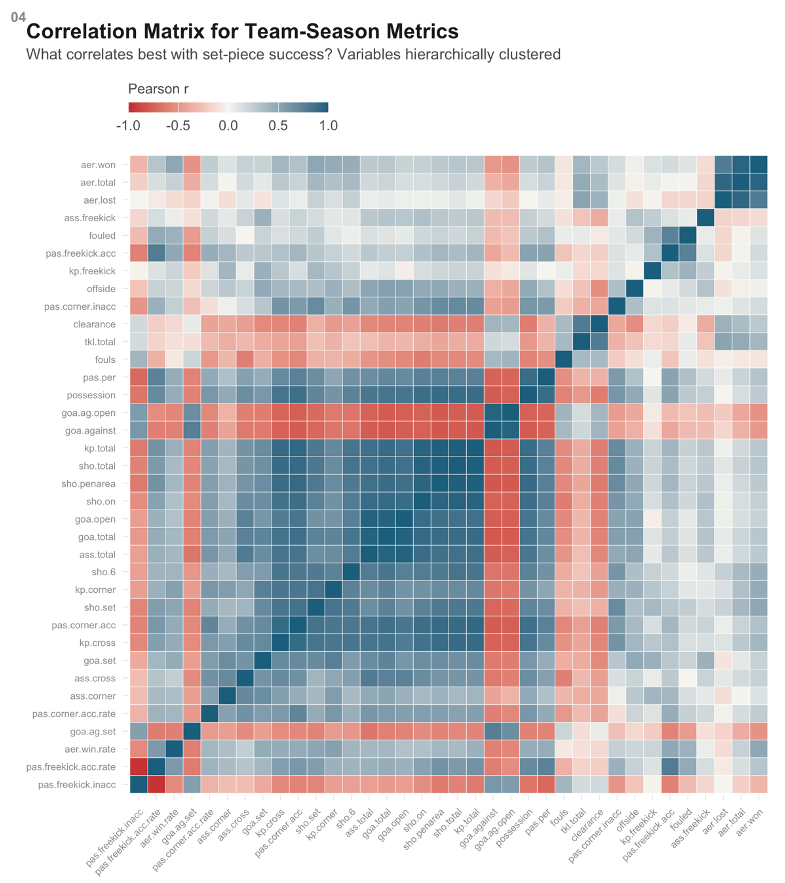
Here, the colours show the Pearson correlation – a deep teal showing a strongly positive correlation, and a deep red showing a strong negative correlation, with paler colours showing zero correlation. These rows are then ordered through hierarchical clustering (rather than alphabetically), meaning variables that behave similarly sit closer to each other, making the overall matrix easier to interpret.
Within the matrix, three main groups jump out. The largest teal block, running through the middle, includes general attacking output statistics (shots, key passes, open play goals etc.), all of which correlate positively with each other. Above it there is a smaller cluster of defensive metrics (clearances, tackles, fouls, opposition shots), correlating negatively with the attacking group. At the top right, there is also the small clump of aerial-duel metrics, showing they are closely correlated to each other, but only loosely tied to the rest.
This shows that scoring from set-pieces certainly lives within the attacking cluster, not in one of its own. Whatever separates good set-piece teams from the rest will likely not be a separate style of play, but instead be something about their general attacking activity.
Whilst this gives a good first glance, for a more detailed look, below we can see which metrics correlate most strongly with set-piece goals.
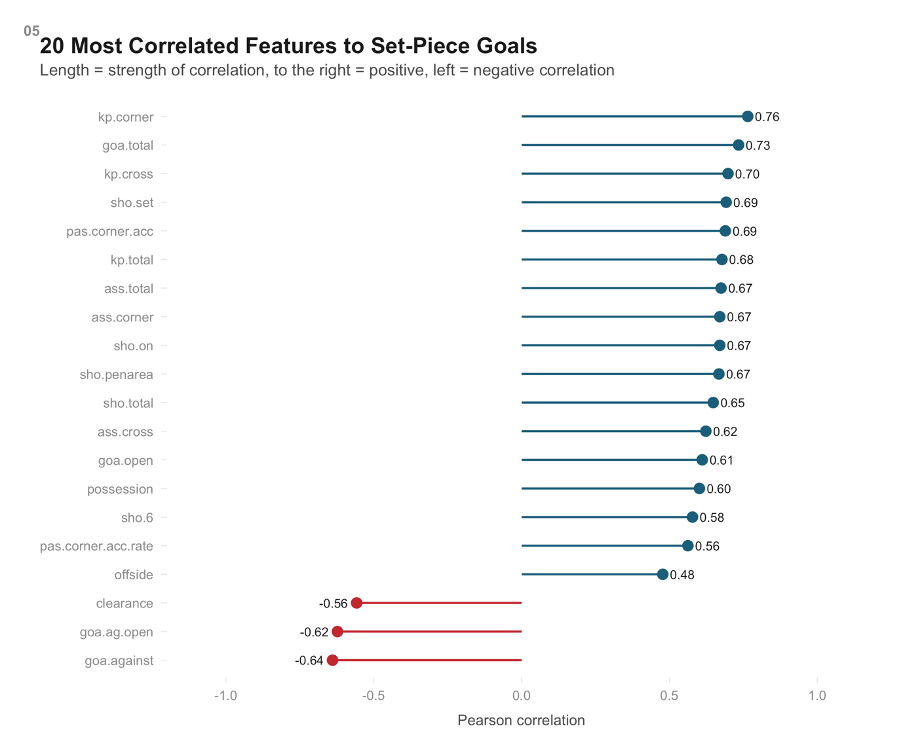
Here, the strongest positive correlates are key passes from corners ( kp.corner , r=0.76), total goals ( goa.total , r=0.73 ), and key passes from crosses ( kp.cross , r=0.70 ). Furthermore, shots from set-pieces, accurate corners, total key passes, total assists, corner assists and shots on target all sit at above r=0.65. These show how these correlation numbers are largely dominated by volume metrics which are indicative of a team’s general attacking output.
The negative correlations are equally telling, with goals against ( goa.against , r=-0.64 ), open-play goals conceded ( goa.ag.open , r=-0.62 ), and clearances ( clearance , r=-0.56 ) sit at the bottom. This shows how teams that are defending more are scoring less from set-pieces, likely as they’re spending more of the match in their own half, without being able to win corners or freekicks that’ll be in a sufficiently dangerous position to score from.
This all illustrates how teams that are good at scoring from set-pieces in the WSL are those that generate plenty of set-piece opportunities, converting them with above-average delivery, and spending more of the match on the foot front. The set-piece-specific metrics, logically, are the strongest predictors, but they form part of the wider attacking profile.
Furthermore, the fact metrics like shots from set-pieces and goals from set-pieces are so closely correlated is due to the mechanical link in how they come about – a goal from set-pieces cannot come without a shot from a set-piece. What is more interesting is the breadth of the profile – the fact possession, total attacking output, and defensive workload all correlates with set-piece goals suggests set-piece scoring travels with the broader attacking profile of a team, not just the set-piece-specific process metrics.
This raises the next logical question: if the correlates of set-piece scoring are dominated by general attacking activity, does that mean good set-piece teams are simply good attacking teams? Or is there a distinct type of team hiding inside the attacking cluster ( a ‘set-piece specialist’ whose profile can be separated from a ‘general attacker’. Correlations alone can not qualify that.
Navigate Table of Contents
Are Good Set-Piece Teams Distinctively Good at Set-Pieces?
As seen before, basic exploratory data analysis and correlations indicate teams good at set-pieces align with each other based on a broader attacking profile. To see whether the likes of Arsenal or West Ham or other consistent set-piece scorers cluster together stylistically, we need to compress our original metrics into a smaller number of underlying dimensions. We do this through principal component analysis (PCA), which finds the axes that capture the most variation in the data – a smaller set of composite dimensions along which teams actually differ
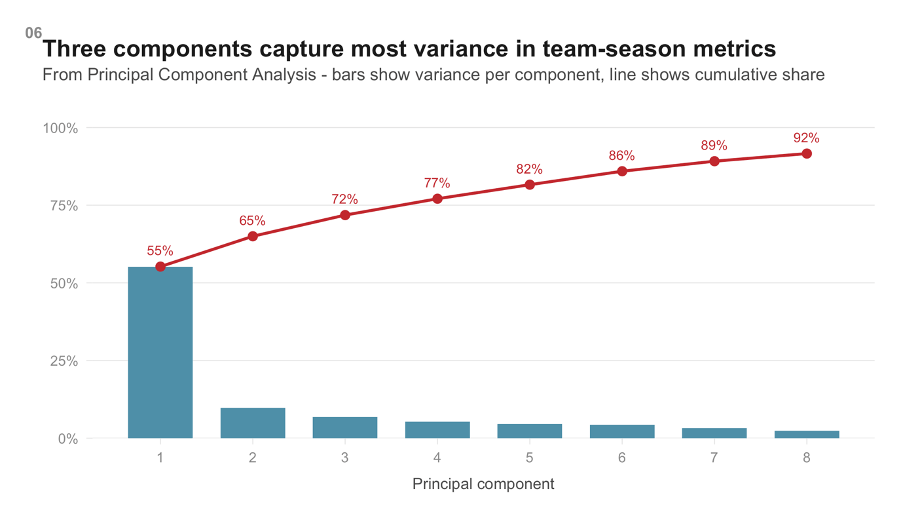
The first principal component (PC1) accounts for 55% of the variation across all team-season metrics, meaning one underlying dimension explains more than half of how WSL teams differ from each other. The second component adds another 10%, and the third adds 7%, at which we reach 72% of the total variance and the ‘elbow’ – where additional components add diminishing amounts.
In footballing terms, however, what does PC1 mean? Looking at the variables that load most heavily on it, it’s essentially the attacking dominance axis (including total shots, key passes, corners on one end, and clearances and goals conceded on the other). Teams that keep the ball high up the field sit on the negative end, whereas teams that sit deep and defend more sit on the positive end. PC2 is subtler, separating high-volume attacking sides form more direct, cross-heavy sides, but PC1 carries most of the discriminating power.
From these two principal components, putting them on opposing axes, we can plot every team-season as a single point to be able to see where good set-piece teams sit.
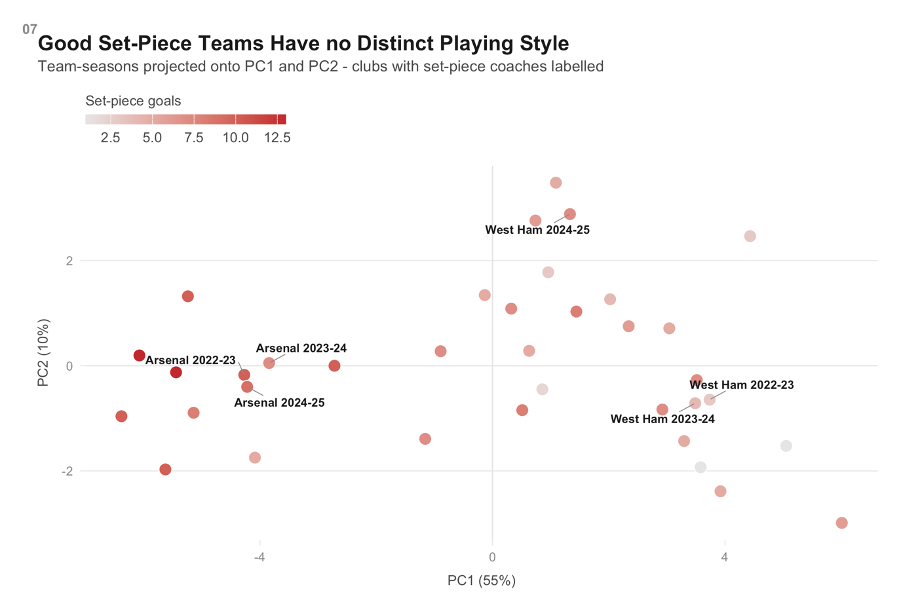
The points are coloured according to set-piece goals scored, with deeper red meaning more goals, and we have highlighted Arsenal and West Ham. The former sits tightly together on the far left of PC1, with all 3 years having a deep red – they’re a possession-dominant, high-attacking-output team, and their set-piece output reflects that.
On the other hand, West Ham’s seasons scatter across the right of PC1. Their 2022-23 and 2023-24 seasons sit further to the right – low-possession, less-attacking – but their set-piece output was also lower (as seen in the lighter colour). Then, in 2024-25, they jump to 7 set-piece goals, and their point noticeably shifts towards the top of the space, indicating their playing profile changed alongside their set-piece output.
Critically, Arsenal and West Ham are both good set-piece teams in the most recent season, but occupy different regions of style space. If being ‘good at set-pieces’ were a distinct playing style, we’d expect the deep-red points to cluster together – but they do not. Instead, we see them from the far-left to the top-centre, and also scattered around the middle of the space.
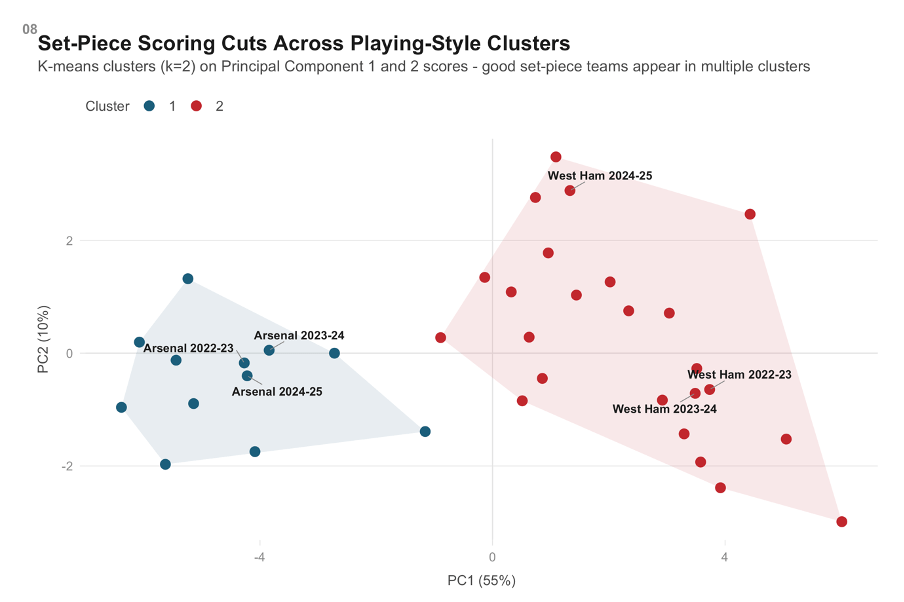
Applying k-mean clustering, a method that clumps data together in clusters and minimises distance for which you pick how many clumps you want ( k=2 here ), splits the plot along PC1, roughly separating the attacking-dominant sides on the left from the defensive / transitional sides on the right. It provides a pretty clean partition, but it doesn’t isolate the good set-piece teams, as they appear in both clusters.
If there were such thing as a style of play for which their playing style was specifically earmarked as set-piece specialists, there would be a more distinct set-piece cluster. However, this is not the case, and instead we take something similar as seen in PC1 – teams differ along an axis of attacking dominance, and set-piece scoring appears at multiple parts along said axis.
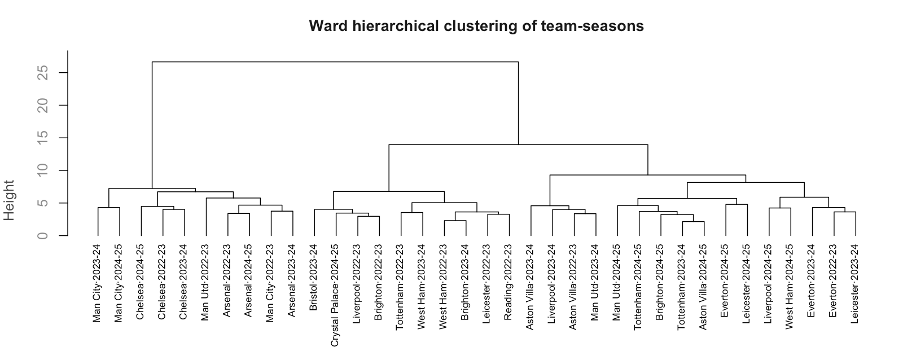
This dendrogram presents the concept in a different way. Arsenal’s previously mentioned seasons sit together far on the left, along with Chelsea’s 3 and Man City’s 2 most recent seasons. This indicates that Arsenal’s peers are possession-dominant sides resemble each other.
West Ham’s seasons do not cluster with Arsenal’s, and they don’t even cluster tightly with each other’s. Instead they sit in and around general mid-table sides with similar overall profiles. Despite the fact both sides score consistently from set-pieces, they end up on drastically different sides of the dendrogram. Whatever they have in common as set-piece performers, it doesn’t show up as a shared playing style at the team level.
These findings can be summarised as: there is no single set-piece playing style in the WSL. Good set-piece teams can reach that outcome from drastically different starting point. Where Arsenal reaches it through possession-dominant consistent attacking, West Ham reaches it through lesser reliance on possession, but produces set-piece goals nonetheless.
This also changes the fundamental question: if good set-piece teams don’t have a specific playing style, and there is something else, there must be a factor which operates within multiple different styles. Therefore, we can use predictive modelling to better understand the phenomena.
Navigate Table of Contents
What Factors Predict Set-Piece Performance?
The previous correlation work showed team’s profiles are broad, and our dimensionality-reduction indicated there’s no specific playing style. So, to predict how good a team will be at set-piece scoring, what variables are most important?
First, we run a LASSO regression – a way to find patterns in data by filtering out unimportant information, telling us which variables carry a unique linear signal. The results of this can be seen below.
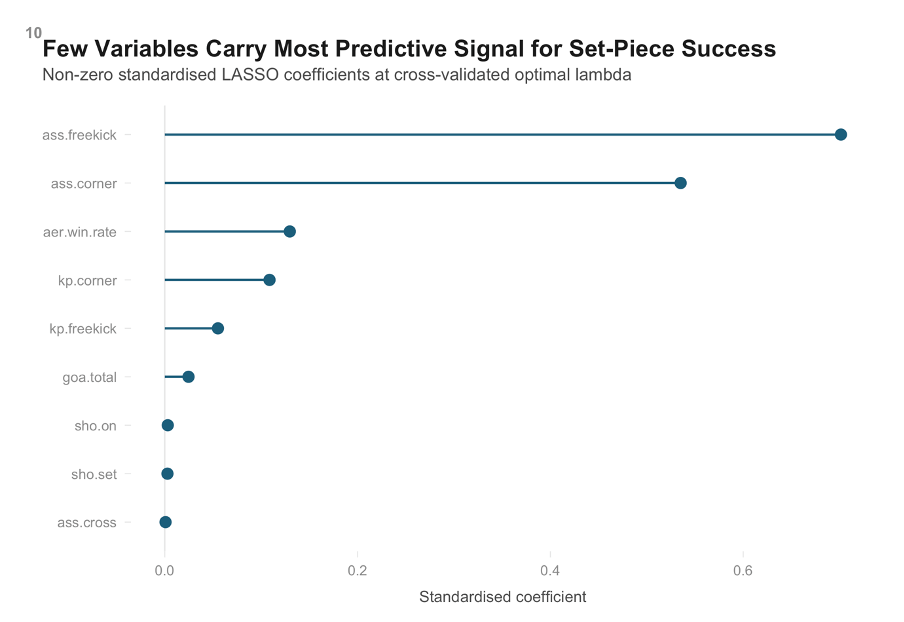
LASSO retains nine variables – two of which are extremely dominating. Assists from free-kicks ( ass.freekick ) carries a coefficient of roughly 0.72 – certainly the largest – and assists from corners follows at around 0.53. Everything else, like aerial win rate, passes from corners, key passes from free-kicks, total goals, shots on target, shots from set-pieces, assists from corners, sit at 0.15 or lower.
The two largest coefficients are both assist metrics from dead-ball situations, which is fairly intuitive considering the assists lead to goals. LASSO is telling us that, once you control for how well a team delivers set-piece assists, most of the other correlates fall away. Whilst corner volume is important, the quality is clearly more important.
Additionally, the presence of aerial duel win rate in the retained set is interesting. It carries a modest coefficient of about 0.13, but appears above several higher-correlation variables. It isn’t the strongest predictor, but surviving penalisation means it adds signal that the assist metrics cannot fully capture.
Then, running a random-forest regression – building hundreds of decision trees from random subsets of data, measuring how much prediction accuracy drops when each variable is scrambled, we can see the results below.
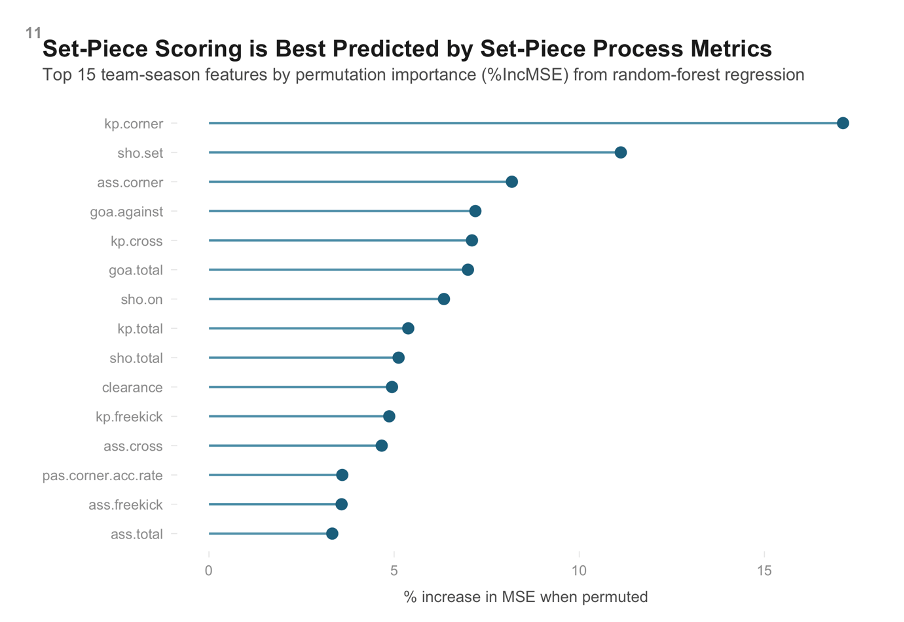
Key passes from corners ( kp.corner ) leads on permutation importance, with a %IncMSE of around 17 (meaning the model’s predictions get 17% worse when the kp.corner data is muddled). Shots from set-pieces ( sho.set ) follows at roughly 11, with corner assists sitting a third then a cluster of variables – goals conceded, key passes from corners, total goals, shots on target – all around 6-7.
Earlier, LASSO emphasised the importance of delivery into scoring positions (the assist), but the RF emphasises the earlier stage (creating the shot). This essentially tells the same story from two angles – teams that score from set-pieces need to:
- Generate set-piece situations
- Create shots from them
- Deliver those shots into positions where a teammate can convert
LASSO emphasises part C, the RF emphasises A and B. Both can agree, however, that the answer to being good from set-pieces is in the set-piece process, and not in general attacking output.
Comparing to the previous correlate work, which was dominated by metrics indicating volume of attacking, our predictive modelling filters that down. Total goals don’t appear in the LASSO retained set, nor does possession. Once we condition on the set-piece process metrics, the broader attacking measures stop adding predictive value, and they correlate with set-piece output because they correlate with the set-piece process metrics, not because they carry an independent signal.
Navigate Table of Contents
Conclusion
So – what makes a good set-piece team?
A team that is good from set-pieces is a team that attacks, but more specifically one that is a prolific creator and generator of opportunities, is able to create shots from these situations, and is able to capitalise upon these shots. Whilst sheer volume of attacking pressure is important, volume alone is insufficient to separate good set-piece teams from those that simply attack more.
This mainly comes from the fact corner volume is likely, in large parts, a byproduct of being an attacking side – the more a team spends in the attacking half, forcing their opposition’s defensive interventions, the more likely you will produce set-piece opportunities. By dominating possession in attack, teams will naturally do that.
Our predictive modelling, however, flags a more narrow concept – the ability to turn set-piece situations into shots on targets and assists at above-average rates. This would not be the byproduct of a tactical factor, but instead suggests the true place for set-piece optimisation is in squad composition.
For example, a team that’s good at set-pieces should have enough players able to consistently deliver good set-piece opportunities – I mention having a few as to not overly hedge your resources on one player who may, for whatever reason, be unavailable, hence drastically worsening your set-piece deliveries.
Furthermore, a team needs enough players who can provide a substantial threat, whether it be directly aerial or operating generally within the box, to be able to convert these chances from set pieces.
Again, here, it is important to have a few players able to convert as to prevent your opposition from focusing more defenders on one or two stellar scorers.
What our analysis can’t fully explain is whether said delivery is coachable, personnel-driven or partly noise from a three-season sample and a limited scoring type.
With our 3 seasons of WSL data, we can describe profiles, but have insufficient information to fully explain how teams end up in these situations. Our two primary teams of focus, Arsenal and West Ham, provide similar yet contrasting profiles – both strong set-piece scorers, but the former being a more possession-dominant side.
Importantly, both also hired a dedicated set-piece coach during our sample window. Whether it is these coaches specifically which provided a substantiative advantage in teams is a different question, and is the question we will seek to answer in my upcoming piece on FC Juanalytics.


Leave a comment